Discover how leading consumer goods companies leverage product carbon footprint data to identify and prioritize high-impact decarbonization opportunities across their value chains.
How leading CPG brands use PCF data to identify decarbonization hotspots
Discover how leading consumer goods companies leverage product carbon footprint data to identify and prioritize high-impact decarbonization opportunities across their value chains.
Topic(s)
Product environmental footprint
,
Supplier engagement
,
Chemicals
,
Last updated
February 18, 2026
Share this insight


Summary
Consumer packaged goods companies face an unprecedented challenge: with approximately 98% of their carbon emissions buried deep within complex supply chains, how do they identify where to focus their decarbonization efforts for maximum impact? The answer lies in product carbon footprint (PCF) data. And the world's leading CPG brands are already using it to revolutionize their sustainability strategies.
Unlike traditional corporate carbon accounting that provides only high-level emissions totals, PCF data offers granular visibility into the carbon intensity of individual products throughout their entire lifecycle. This product-level precision is transforming how companies like Unilever, Nestlé, and Procter & Gamble identify and tackle their biggest decarbonization opportunities.
The PCF advantage in hotspot identification
Traditional carbon accounting approaches leave sustainability leaders flying blind when it comes to prioritizing decarbonization investments. Corporate-level Scope 3 reporting might reveal that "purchased goods and services" represents around 80% of total emissions for retailers, but it doesn't answer the crucial question: which specific products, suppliers, or processes within that category offer the greatest reduction potential?
Product carbon footprint data changes this dynamic entirely. By calculating emissions at the individual product level, from raw material extraction through manufacturing, distribution, use, and end-of-life, PCF analysis reveals precisely where carbon concentrations occur across a company's portfolio.
This granular approach enables what sustainability experts call "carbon hotspot mapping", the systematic identification of emission-intensive stages within product lifecycles that represent both the greatest risk and the highest-impact reduction opportunities. Rather than making broad investments across entire supply chains, companies can target their resources where they'll deliver the most substantial carbon reductions.
The timing couldn't be more critical. With new regulations like the Corporate Sustainability Reporting Directive (CSRD) requiring more detailed environmental disclosures, and major retailers demanding PCF data from suppliers, companies that master PCF-driven hotspot identification gain both compliance advantages and competitive differentiation.
How leading CPG brands approach PCF-driven hotspot analysis
1. Unilever's comprehensive PCF methodology
Unilever has emerged as an industry pioneer in PCF-driven decarbonization, analyzing carbon footprints across their extensive product portfolio. Their approach revealed that agricultural raw materials represent the largest hotspot across their portfolio, with over half of the emissions in scope of their net zero ambition coming from raw materials and ingredients.
Through detailed PCF analysis, Unilever identified that palm oil cultivation in Indonesia represented 18% of total product emissions across their portfolio but only 6% of raw material spend—revealing a critical hotspot that traditional spend-based analysis would have missed. This insight drove Unilever's strategic focus on regenerative agriculture programs, working directly with suppliers to reduce the carbon intensity of key ingredients like palm oil, soy, and dairy.
Through their Supplier Climate Programme, 181 suppliers participated in 2024, sharing carbon footprint data for the materials they supply and working on decarbonization opportunities. Their regenerative agriculture projects have covered 130,000 hectares of land since 2021, leading to measurable reductions across major brands like Dove, Hellmann's, and Ben & Jerry's.
2. Nestlé's agriculture-focused hotspot strategy
Nestlé's PCF analysis across their global portfolio revealed that agricultural ingredients contribute approximately two-thirds of their total emissions, with dairy and coffee representing the most carbon-intensive categories.
The company's detailed coffee supply chain analysis revealed that processing and roasting contributed only 12% of total coffee product emissions, while farming practices and land use change contributed 67%, completely reshaping their intervention priorities. This precision enabled Nestlé to develop targeted interventions, including direct farmer support programs and sustainable sourcing initiatives that focus on agricultural practices rather than manufacturing efficiency.
Nestlé achieved a net reduction of 13.5% of its greenhouse gas emissions in 2023 compared to its 2018 baseline, demonstrating the effectiveness of their hotspot-focused approach.
3. L'Oréal's multi-category hotspot approach
L'Oréal's climate transition plan shows how health and hygiene brands can address hotspots systematically across diverse product categories. With an annual carbon footprint of around 11.5 million tonnes of CO2 equivalent, their PCF analysis revealed that skincare products showed 45% of emissions from ingredient sourcing, while haircare products were dominated by packaging materials at 38% of total emissions.
This category-specific insight enabled L'Oréal to identify that achieving their 2030 targets requires accelerated raw material decarbonization in four main areas: product formulation, packaging, manufacturing processes, and supply chain optimization.
Common hotspot patterns by CPG category
PCF analysis across leading CPG brands reveals distinct hotspot patterns that vary significantly by product category, enabling more targeted identification strategies:
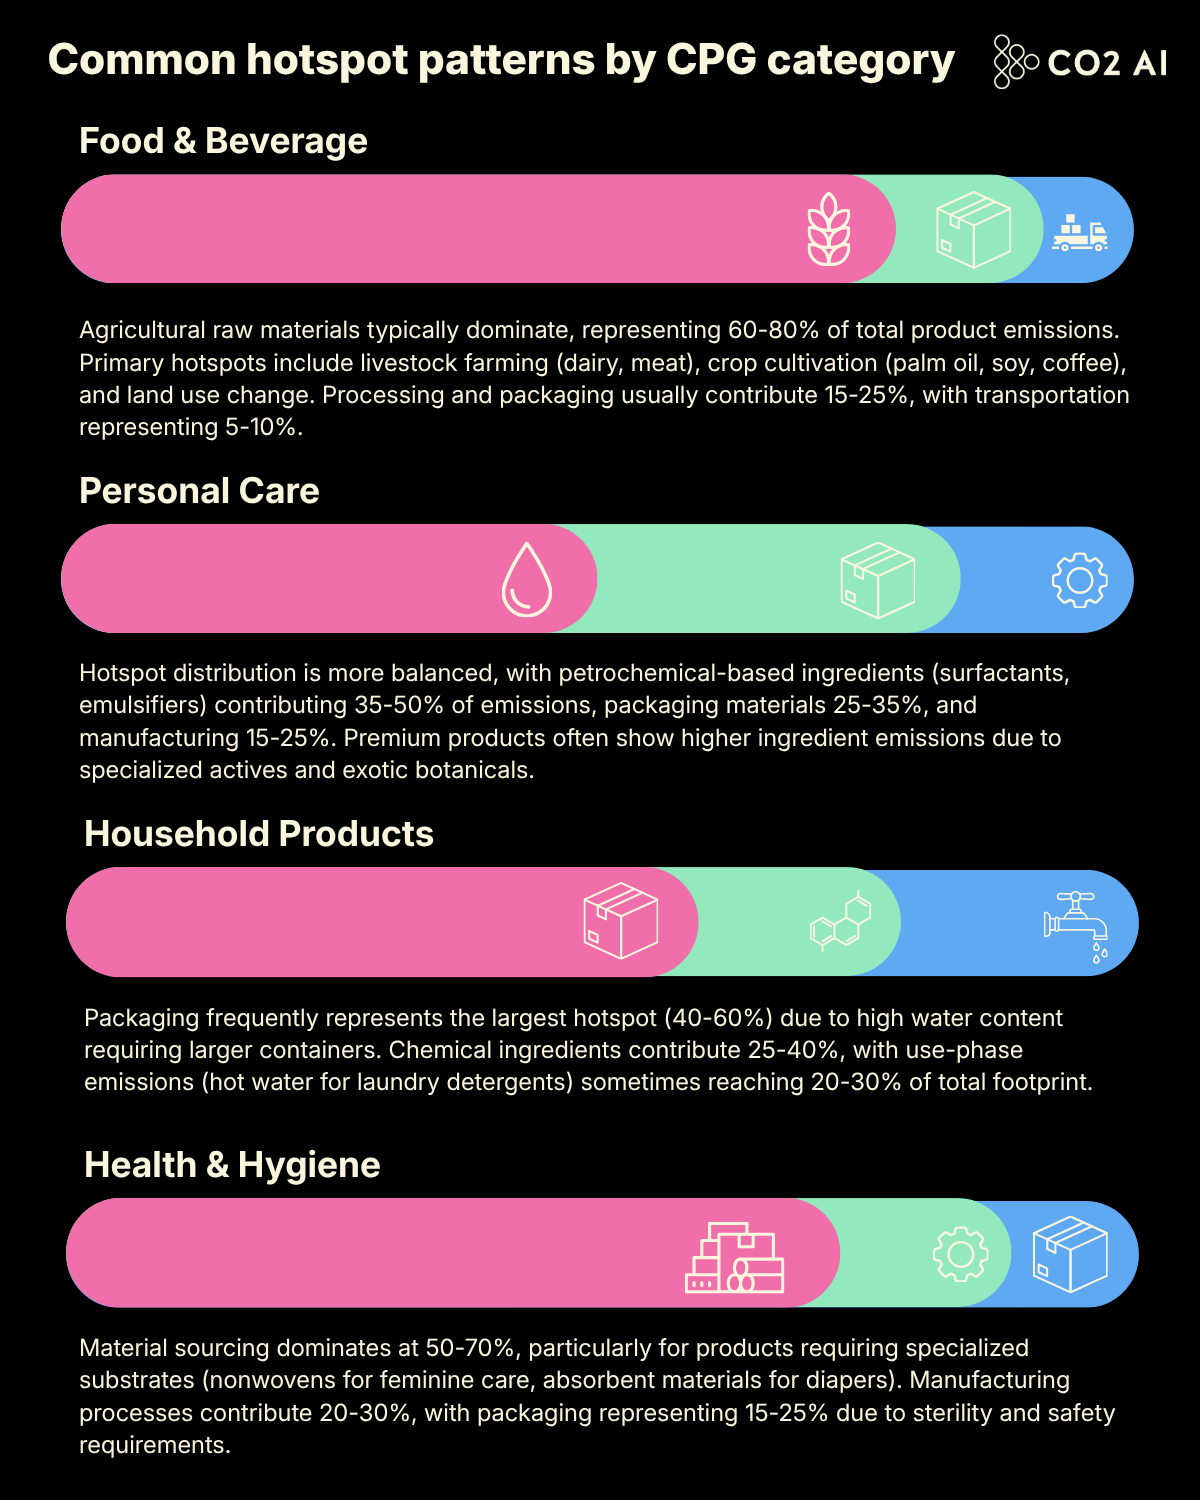
Understanding these category-specific patterns enables CPG companies to focus their initial PCF data collection efforts on the most material emission sources, accelerating hotspot identification timelines.
The four-step framework for PCF hotspot identification
Leading CPG companies follow a systematic approach to PCF-driven hotspot identification that any sustainability leader can adapt, based on methodologies developed by leading consulting firms:
Step 1: Comprehensive PCF data collection
The foundation of effective hotspot identification lies in comprehensive, accurate PCF data collection across your product portfolio. However, the reality of supplier data availability presents the single greatest challenge most CPG companies face when implementing PCF programs.
The Data Reality Challenge
Industry experience shows that typically fewer than 20% of suppliers can provide primary PCF data in Year 1 of engagement programs. Mature PCF programs typically see this improve to 30-40% primary data coverage by Year 2 and 50%+ by Year 3, as supplier capabilities develop and engagement processes scale.
This creates an immediate challenge: how do you identify meaningful hotspots when most of your emissions data comes from secondary sources or spend-based estimates? Leading companies address this through a tiered data approach:
- Primary Data (Tier 1): Supplier-specific PCF calculations based on actual production data, energy consumption, and material inputs. This provides the highest accuracy but is typically available for only strategic suppliers initially.
- Secondary Data (Tier 2): Industry-average emission factors adjusted for specific materials, regions, or production methods. While less precise than primary data, high-quality secondary data can still reliably identify major hotspots.
- Spend-Based Estimates (Tier 3): Emission factors applied to procurement spend data. This provides broad coverage but limited precision for hotspot identification.
Managing the Speed vs. Accuracy Trade-off
CSOs must balance the desire for comprehensive, accurate data against the business need for timely insights. Companies calculating emissions at the product level are four times more likely to see significant decarbonization benefits, but waiting for perfect data can delay action for years.
The most effective approach involves starting with the best available data—often a mix of all three tiers—and systematically upgrading data quality for the highest-impact hotspots identified in the initial analysis. Companies using AI are 4.5 times more likely to experience significant decarbonization benefits.
When suppliers cannot provide primary data, successful companies employ several strategies:
- Proxy Data Modeling: Using similar products or suppliers as proxies, adjusted for key variables like geography, scale, or technology
- Hybrid Approaches: Combining partial supplier data with industry benchmarks to improve accuracy over pure secondary data
- Phased Engagement: Prioritizing primary data collection from suppliers representing the largest emission contributions or greatest reduction potential
The key is acknowledging data limitations while still extracting actionable insights. A hotspot identified with 70% secondary data is still more valuable than broad-based interventions with no prioritization framework.
Step 2: Cross-product portfolio analysis
Once comprehensive PCF data is available, the next step involves analyzing patterns across your entire product portfolio to identify systemic hotspots. This analysis should examine emissions by product category, geographic region, supplier, and lifecycle stage to reveal both obvious and hidden concentration points.
McKinsey research shows that for retailers, apparel manufacturers, and food processors, the upstream value chain accounts for 70 to 75 percent of their Scope 3 emissions, with purchased material, including raw materials, ingredients, and packaging, being the primary source.
Advanced analytics can uncover non-intuitive patterns, for example, that premium product lines often have disproportionately high emissions due to specialized ingredients or packaging, or that certain manufacturing facilities contribute outsized emissions due to energy sources or process inefficiencies.
Step 3: Impact vs. feasibility mapping
Not all hotspots are created equal from a strategic perspective. The third step involves mapping identified hotspots against two critical dimensions: potential emission reduction impact and implementation feasibility. This creates a prioritization matrix that guides resource allocation decisions.
McKinsey analysis indicates that retailers could reduce their Scope 3 emissions by 15% by 2030 with existing technologies, or as much as 50% with new technologies and pathways. High-impact, high-feasibility hotspots become immediate priorities for intervention programs.
This analysis must also consider regulatory requirements, customer demands, and competitive dynamics. A hotspot that represents modest emission reductions might still warrant priority if it addresses emerging regulatory requirements or customer sustainability criteria.
Step 4: Strategic intervention planning
The final step translates hotspot identification into actionable decarbonization strategies. This involves developing specific intervention plans for priority hotspots, including supplier engagement programs, product reformulation initiatives, packaging optimization projects, and manufacturing process improvements.
Successful intervention planning requires close collaboration between sustainability, procurement, R&D, and operations teams, with procurement playing a particularly critical role. Supplier engagement for PCF data collection and decarbonization is fundamentally a procurement function, requiring buyer relationships, contract leverage, and supplier performance management capabilities that sustainability teams typically don't possess. Leading companies embed sustainability metrics into procurement scorecards and RFP processes to ensure alignment.
Technology enablers for hotspot identification
The complexity of calculating and analyzing PCF data across thousands of products has driven innovation in carbon accounting technology specifically designed to accelerate hotspot identification. Leading CPG companies increasingly rely on AI-powered platforms that can process vast amounts of supplier data and automatically identify emission concentration patterns.
Companies measuring all three scopes comprehensively are 1.6 times more likely to experience significant decarbonization benefits. Modern platforms integrate with existing ERP and procurement systems to access product formulation data and supplier information, enabling automated hotspot detection across entire product portfolios.
CO2 AI's platform exemplifies this next-generation approach to PCF-driven hotspot identification. The platform's automated data-to-footprint workflow delivers x200 increased speed to complete PCFs, combining AI-assisted emission factor matching with systematic hotspot analysis to identify the highest-impact intervention opportunities across CPG portfolios.
Key capabilities for hotspot identification include automated supplier data collection, AI-powered pattern recognition across product categories, and benchmarking tools that compare emission intensities across similar products to reveal outliers and optimization opportunities. Companies like Reckitt have demonstrated the impact potential, achieving 75x increased footprint accuracy while collecting 300,000 data points in 2023.
Related Resource: SPARC Program for Specialty Supplier Engagement
For CPG companies struggling to engage specialty suppliers critical to complex chemical portfolios, CO2 AI's Supplier Partnership for Accelerating Climate Action (SPARC) program offers an 8-week supplier acceleration solution. The co-financed model removes cost barriers to engaging specialty suppliers, while expert-led training guides suppliers through PCF calculation and hotspot identification. The program delivers PACT-compliant PCFs with ingredient-level insights that enable precise hotspot identification across complex formulations.
Learn more about SPARC for CPG companies.
Validating hotspot identification accuracy
Effective PCF-driven hotspot identification requires robust validation frameworks that ensure identified priorities are reliable and actionable. Leading companies monitor several key indicators to validate their identification processes:
- Data Quality Validation tracks the reliability of identified hotspots by monitoring the percentage of primary vs. secondary data underlying each hotspot, conducting sensitivity analysis to test how data quality variations affect hotspot rankings, and implementing systematic data validation processes with suppliers.
- Hotspot Consistency Metrics measure whether similar products show consistent hotspot patterns, validate that identified hotspots align with category-specific expectations (e.g., agriculture-dominant for food products), and track how hotspot identification evolves as data quality improves over time.
- Cross-Validation Approaches include comparing PCF-identified hotspots with spend-based analyses to identify discrepancies, benchmarking hotspot patterns against industry peers and published studies, and conducting periodic third-party reviews of hotspot identification methodologies.
Data Assurance and Verification
As PCF programs mature and regulatory requirements intensify, third-party verification becomes increasingly critical for hotspot identification accuracy. CSRD requires limited assurance of sustainability disclosures starting in 2025-2026 for many CPG companies, while major customers often require verified PCFs for supplier qualification.
Verification typically involves reviewing calculation methodologies, auditing data sources, and confirming compliance with relevant standards (PACT, ISO 14067, GHG Protocol). For hotspot identification programs, the focus is ensuring that data quality is sufficient to support confident prioritization decisions—even if individual PCF values carry uncertainty ranges.
CSOs should plan for verification early, as audit-ready documentation and traceability requirements are much easier to implement from the start than to retrofit later. Leading platforms like CO2 AI build verification readiness into their architecture through systematic documentation, data lineage tracking, and compliance with established PCF standards.
For health and hygiene brands specifically, validation should include comparing identified material sourcing hotspots against known industry patterns, verifying that manufacturing process hotspots align with facility-level energy and process data, and ensuring that packaging hotspots reflect actual material composition and weight data rather than generic estimates.
Conclusion
The future of CPG sustainability lies in precision, the ability to identify exactly where emissions occur and target interventions accordingly. Product carbon footprint data provides this precision, transforming sustainability from a broad corporate initiative into a strategic, data-driven discipline that delivers measurable results.
Companies that master PCF-driven hotspot identification will not only achieve their decarbonization goals more efficiently but also gain competitive advantages through optimized operations, enhanced supplier relationships, and products that meet evolving consumer and regulatory demands. As BCG research shows, 25% of companies reported annual decarbonization benefits worth at least 7% of sales, equating to about $200 million in net benefits after investments.
Sources
- Peter Spiller and Steve Hoffman, "Retailers' climate road map: Charting paths to decarbonized value chains", July 31, 2024, https://www.mckinsey.com/capabilities/sustainability/our-insights/retailers-climate-road-map-charting-paths-to-decarbonized-value-chains
- Justin Manly et al., "Consumer Companies Must Innovate to Drive Impact on Climate", April 27, 2023, https://www.bcg.com/publications/2023/consumer-companies-need-innovative-climate-change-solutions-to-drive-impact
- Unilever, "Addressing climate change with action", 2025, https://www.unilever.com/planet-and-society/climate-action/
- CarbonStop, "Nestle, with a 140 year history, is committed to reducing carbon emissions throughout the entire food and beverage industry", September 16, 2022, https://www.carbonstop.com/en/dualcarboninsight/4073.html
- WBCSD, "Nestlé reduces its greenhouse gas emissions in 2023 and delivers significant progress against its net zero ambition", 2024, https://www.wbcsd.org/news/nestle-reduces-its-greenhouse-gas-emissions-in-2023-and-delivers-significant-progress-against-its-net-zero-ambition/
- Green Digest, "Evaluating a company's impact (the case of L'Oréal)", 2024, https://www.greendigest.co/p/evaluating-a-company-s-impact-the-case-of-l-or-al
- L'Oréal, "Climate Transition Plan", December 2023, https://www.loreal.com/-/media/project/loreal/brand-sites/corp/master/lcorp/documents-media/publications/20231222climate-transition-planvf-approved.pdf
- Charlotte Degot et al., "Boosting your bottom line through decarbonization", 2024, https://www.co2ai.com/carbon-survey-2024
- Charlotte Bricheux et al., "Tackling Scope 3 emissions through supplier collaboration", January 17, 2024, https://www.mckinsey.com/capabilities/sustainability/our-insights/sustainability-blog/tackling-scope-3-emissions-through-supplier-collaboration

Ready to unlock the power of product-level carbon insights for your brand? Read our guide to learn how to efficiently measure PEFs across your entire portfolio, with expert advice from CO2 AI, Quantis, and WBCSD.
Discover other insights
.jpg)

April 10, 2026
From Theory to Invoice: What the First CBAM Certificate Price Means for Your PCF Strategy
For companies importing iron, steel, aluminium, cement, fertilizers, or hydrogen into the EU, carbon pricing on imports is no longer a planning exercise.
Read insightSustainability regulations

April 8, 2026
Webinar Recap: How to Convince Your CFO That Sustainability Drives Profitability
Insights from CO2 AI's webinar with P&G, BCG, and the American Cleaning Institute on how sustainability teams can build and defend the business case for carbon investment.
Read insightDecarbonization

.svg)

What would you like to read next?